> ## Documentation Index
> Fetch the complete documentation index at: https://enrolla-gz-new-docs-for-auto-monitor.mintlify.site/llms.txt
> Use this file to discover all available pages before exploring further.

# Posthog

> Connect Traceloop to Posthog to combine LLM insights with your product analytics

Connecting Traceloop to Posthog can be done by following these steps:

<Steps>
  <Step title="Get the needed data from Posthog">
    Go to your Posthog instance settings and get the following data:

    * API URL (should be something like `https://us.i.posthog.com`)
    * Project API key (should be in the format `phc_-<key>`)
  </Step>

  <Step title="Set up the Integration within Traceloop">
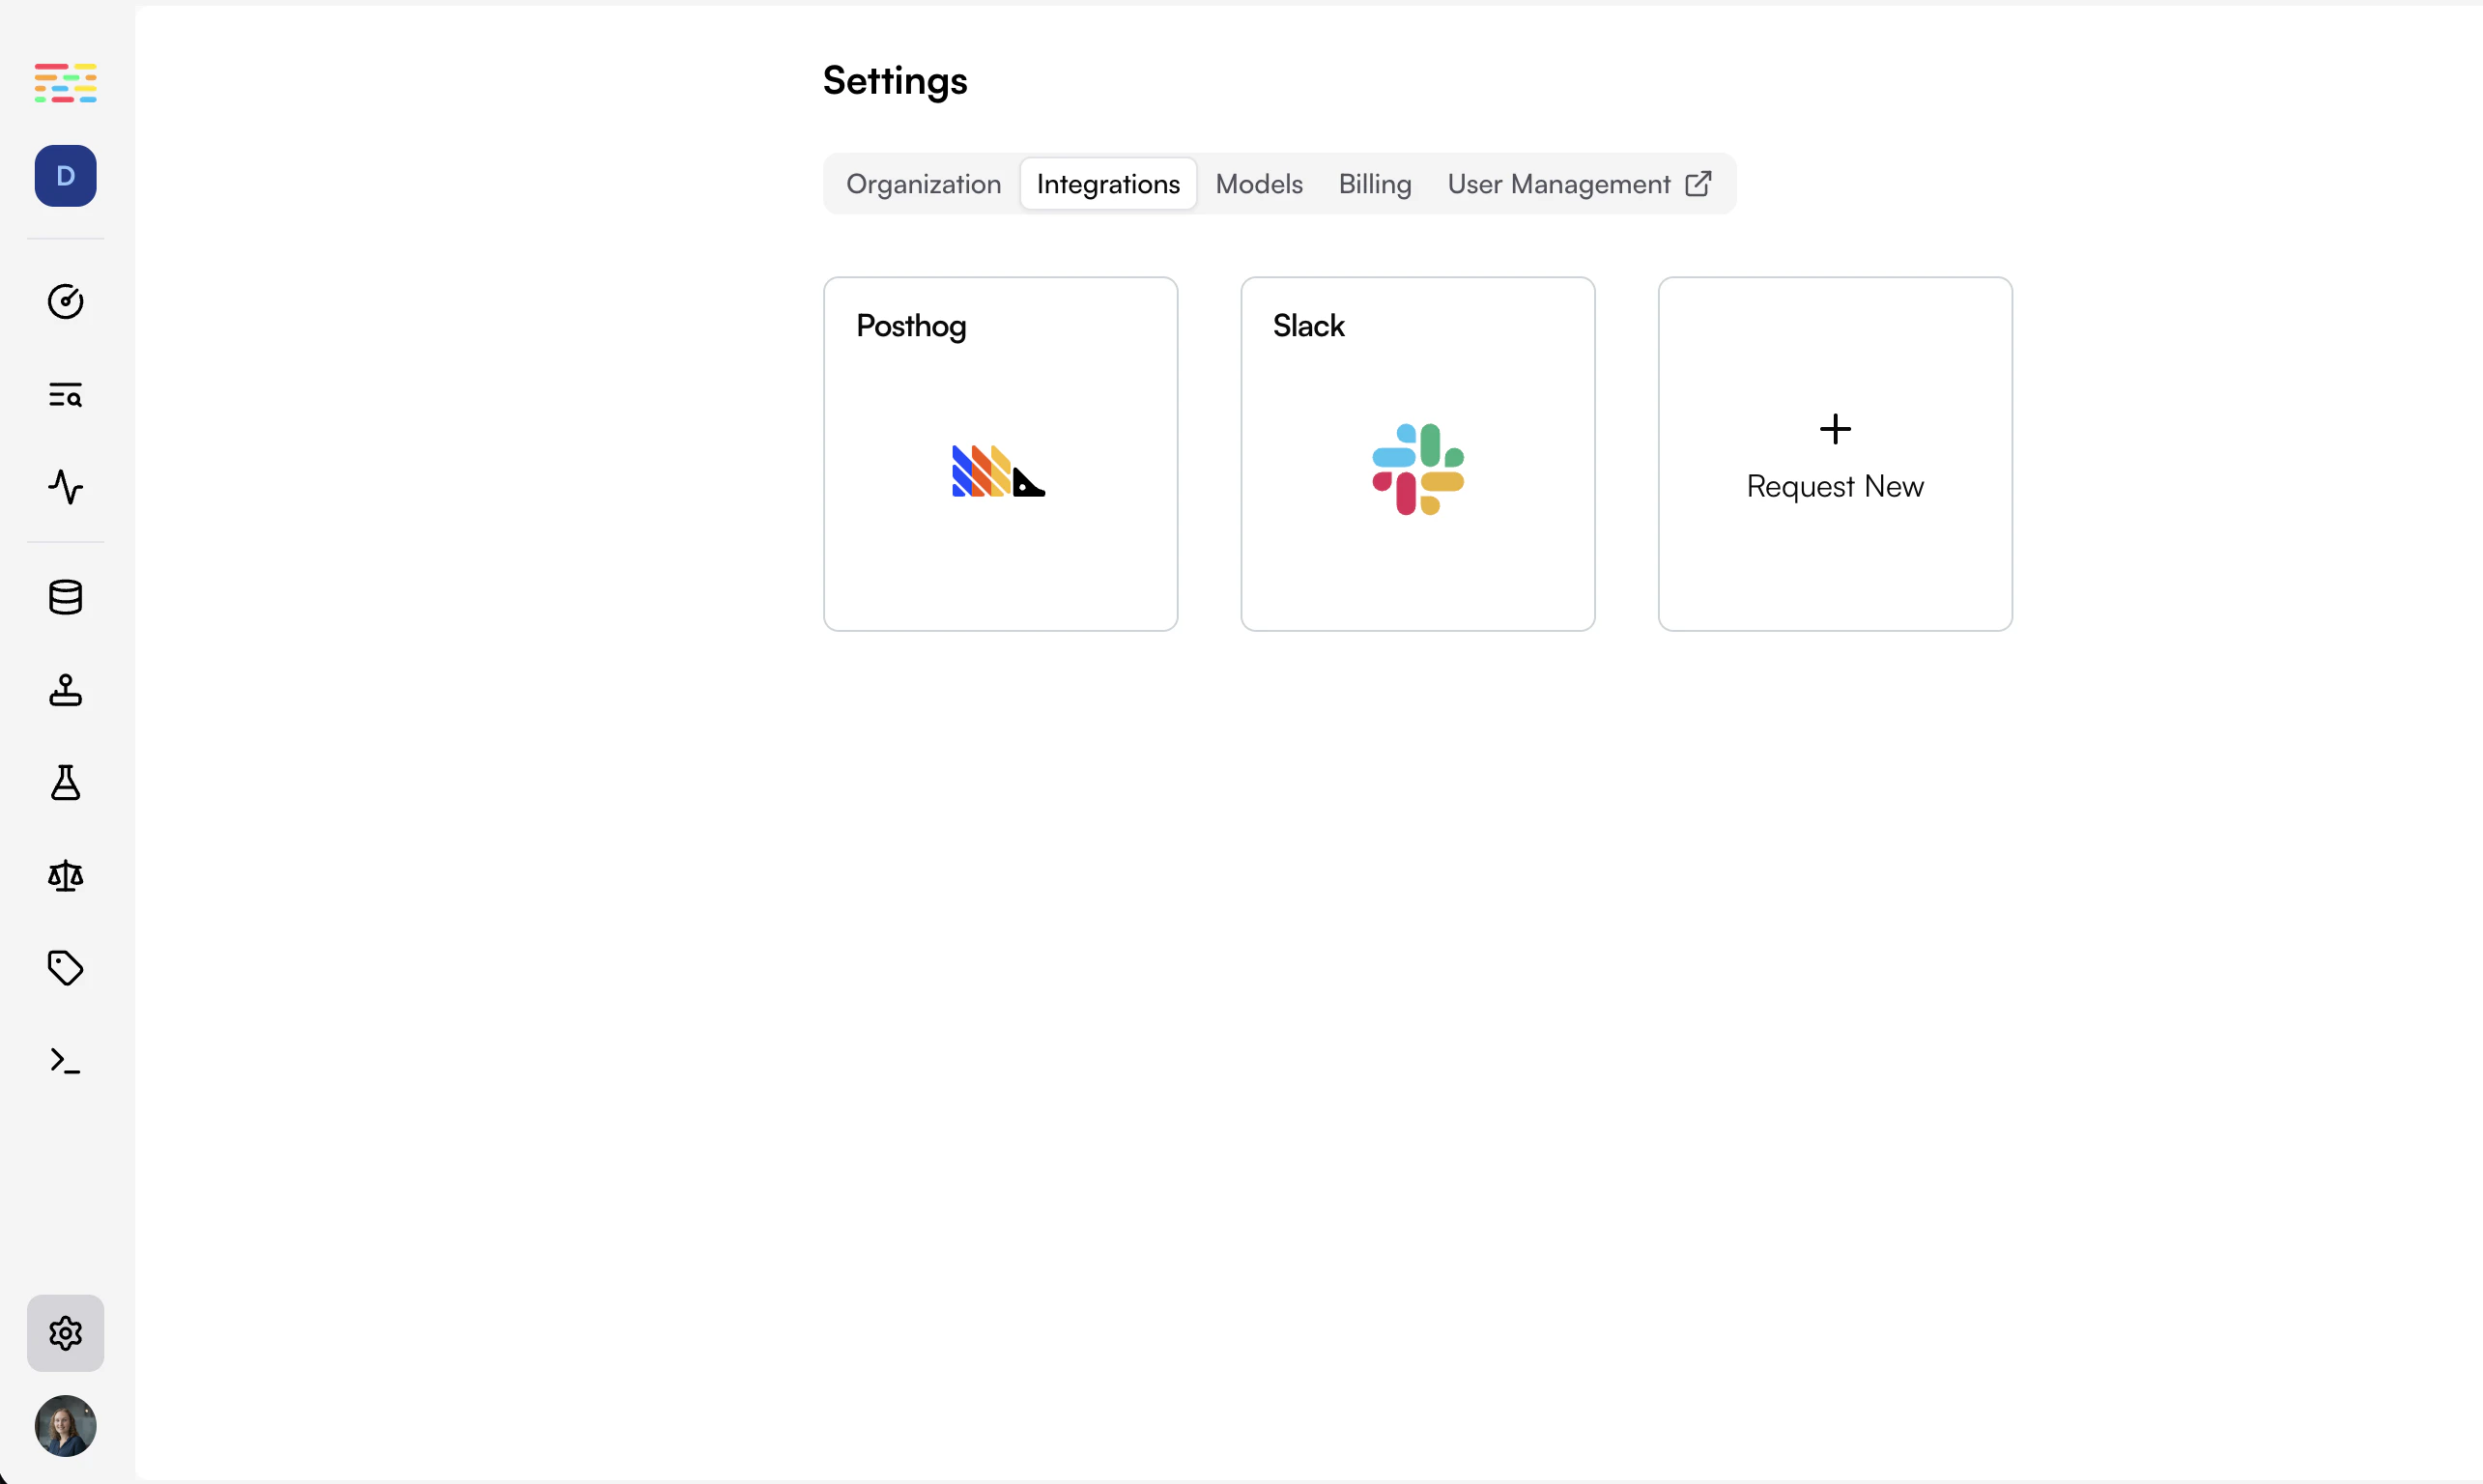
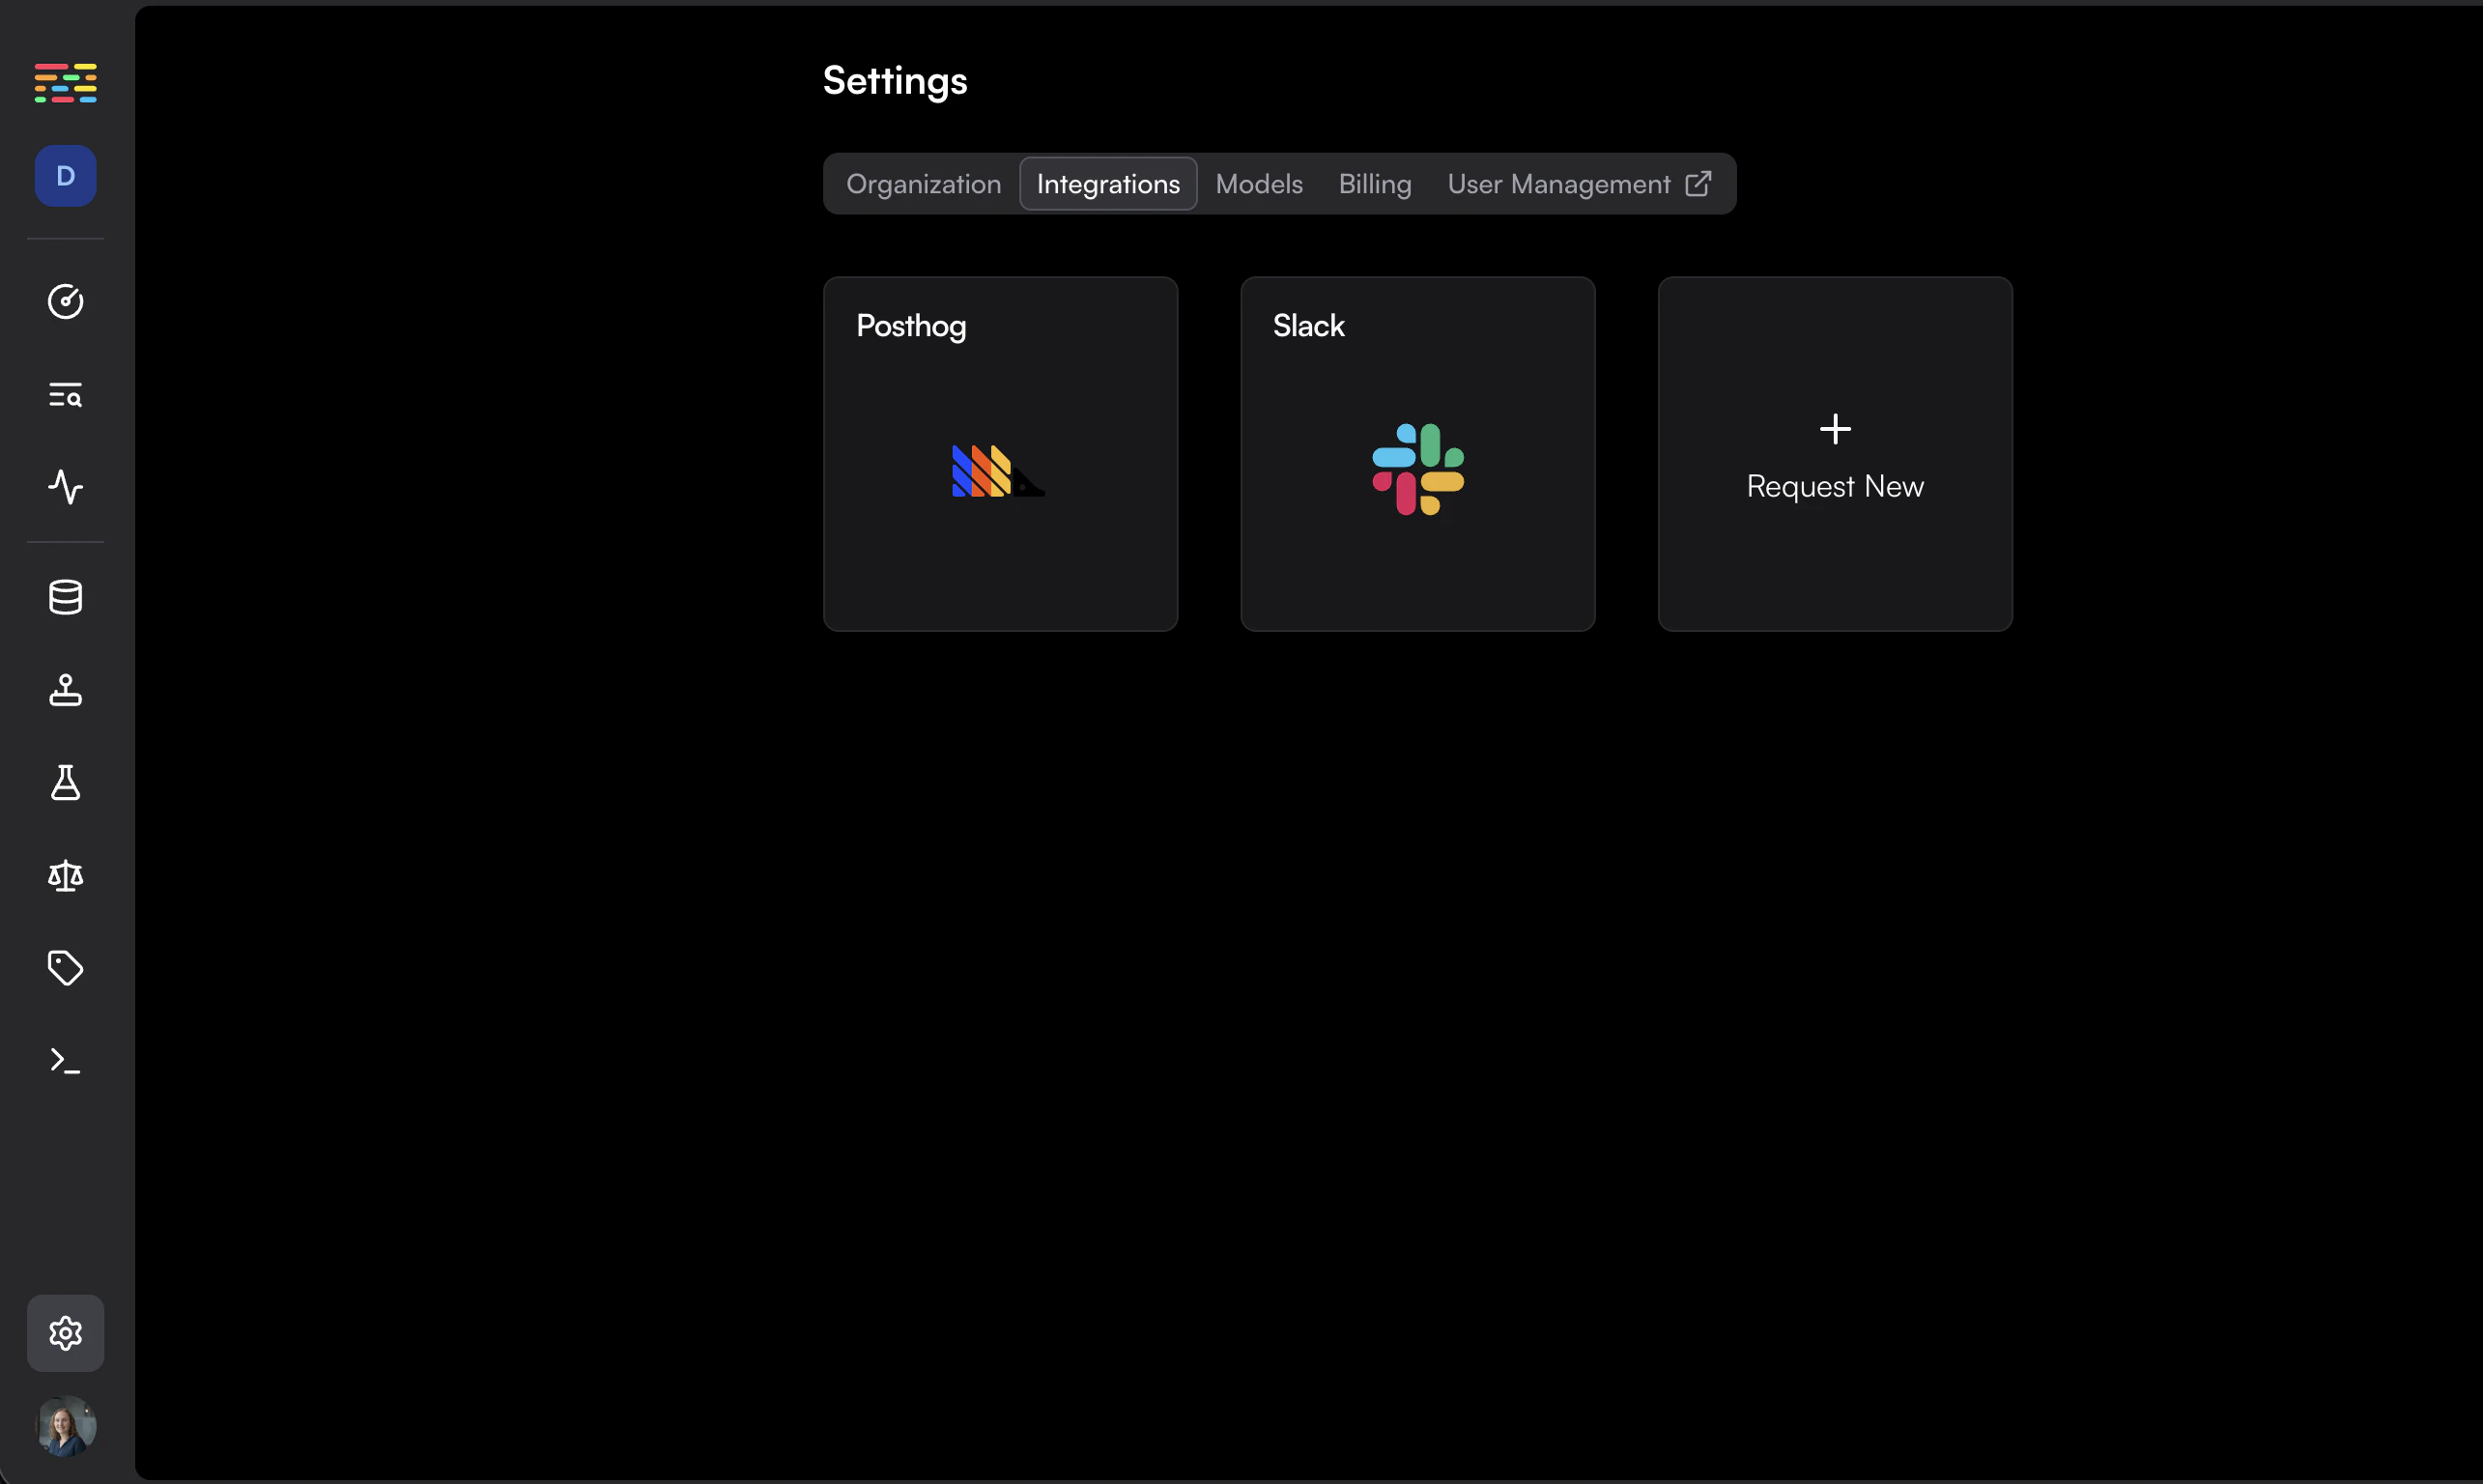
    Go to the [integrations page](https://app.traceloop.com/settings/integrations) within Traceloop and click on the Posthog card.
    <Frame>
      <img className="block dark:hidden" src="https://mintcdn.com/enrolla-gz-new-docs-for-auto-monitor/I-AuNb0y0xUa8HdE/img/traceloop-integrations/integrations-light.png?fit=max&auto=format&n=I-AuNb0y0xUa8HdE&q=85&s=20ce173eea09c5a79fb802da847ae61d" width="2570" height="1536" data-path="img/traceloop-integrations/integrations-light.png" />

      <img className="hidden dark:block" src="https://mintcdn.com/enrolla-gz-new-docs-for-auto-monitor/I-AuNb0y0xUa8HdE/img/traceloop-integrations/integrations-dark.png?fit=max&auto=format&n=I-AuNb0y0xUa8HdE&q=85&s=25706a0124e196126bafcd5f1634b4d7" width="2570" height="1536" data-path="img/traceloop-integrations/integrations-dark.png" />
    </Frame>
  </Step>

  <Step title="Fill in the form">
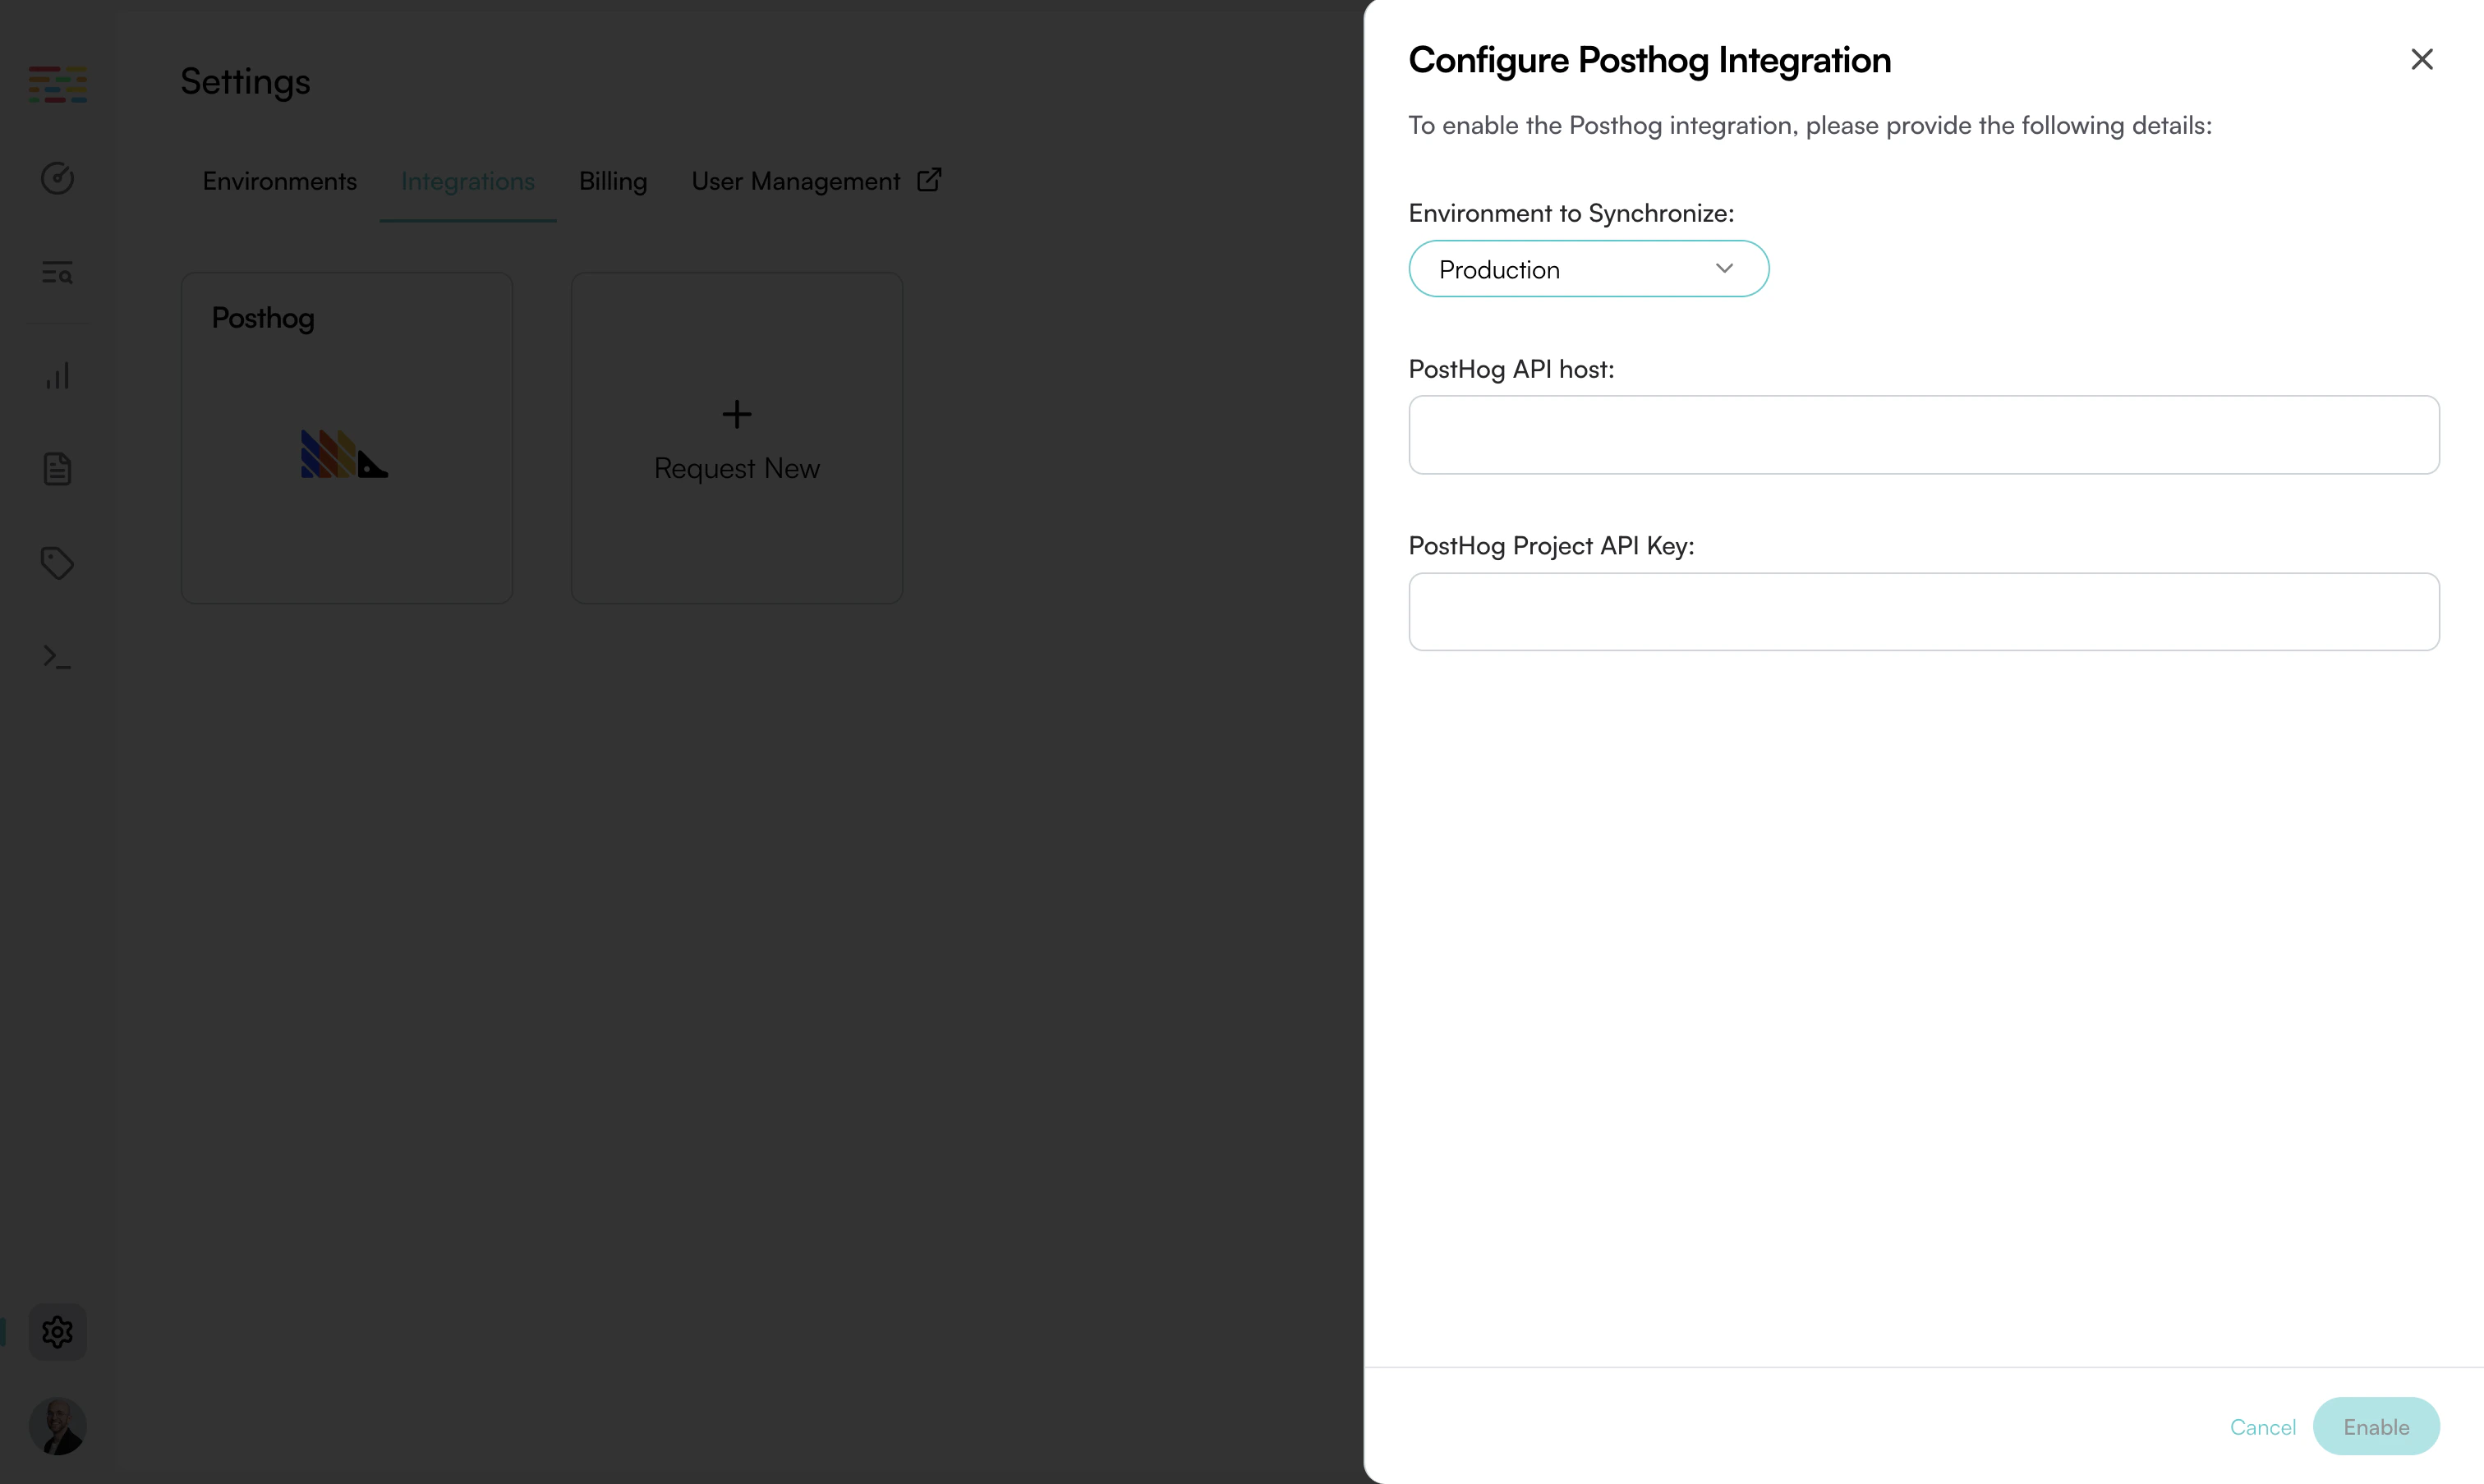
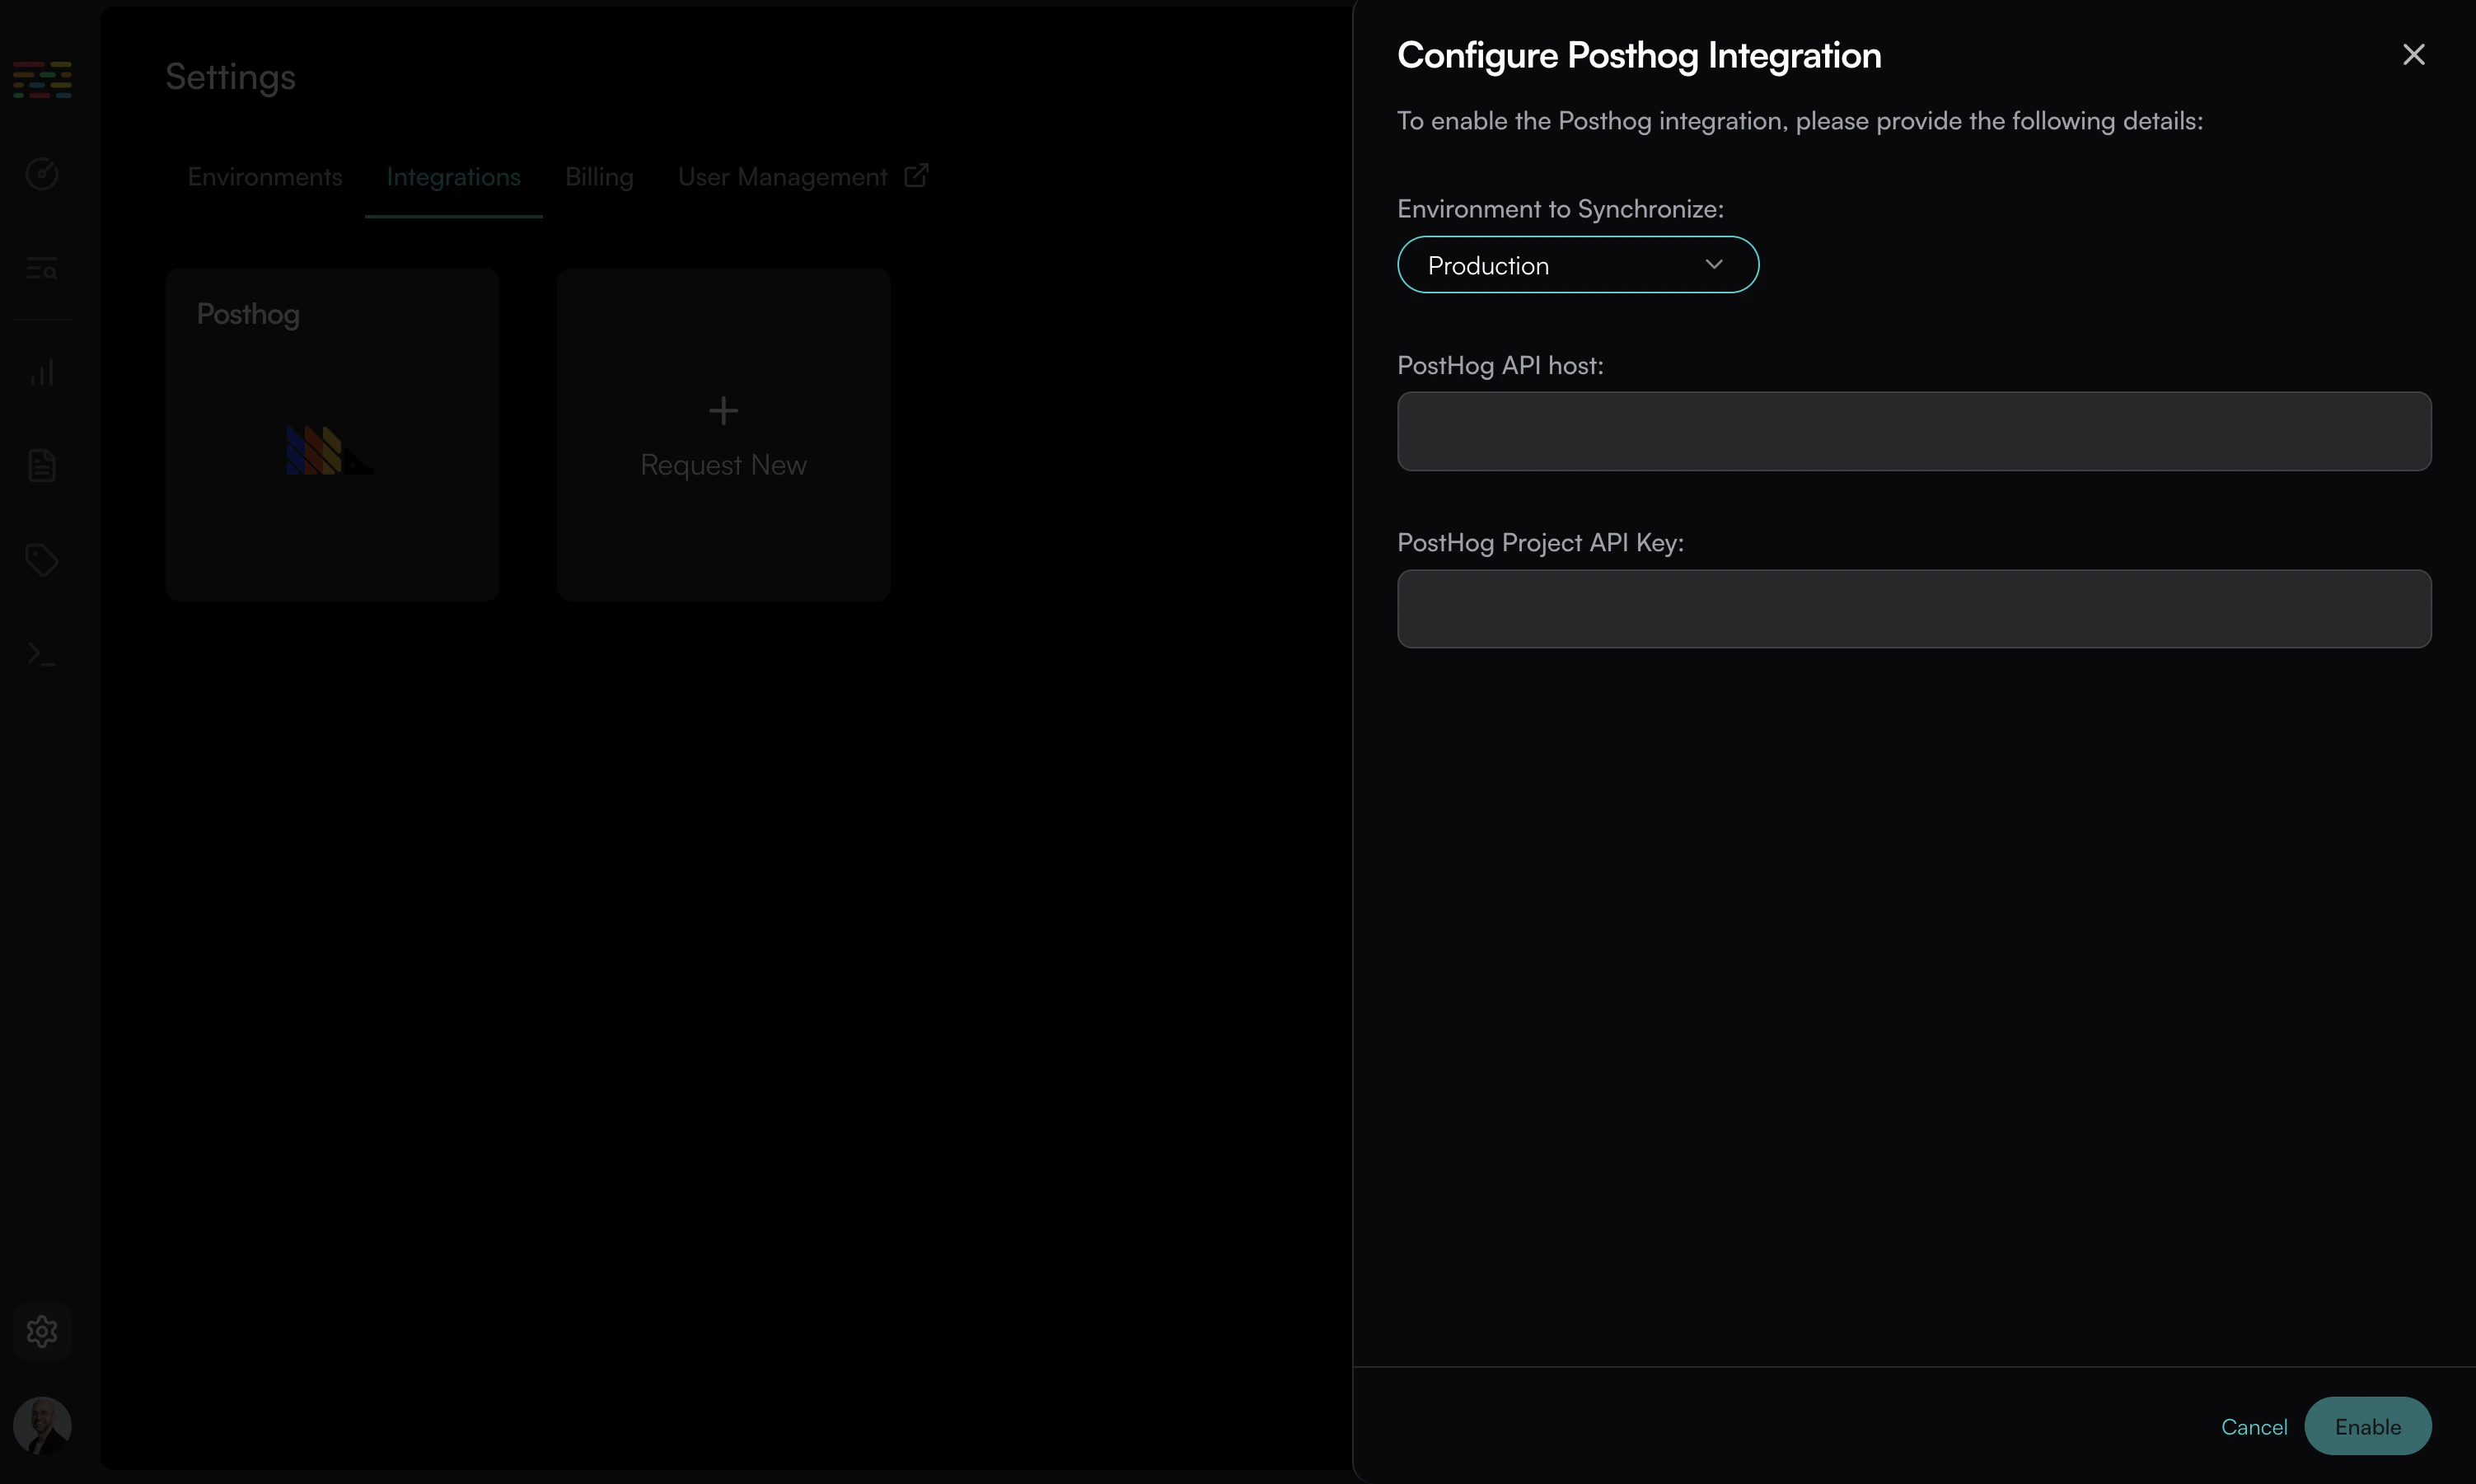
    Fill in the data you got from Posthog. Choose the environment you want to connect to Posthog and click on "Enable".
    <Frame>
      <img className="block dark:hidden" src="https://mintcdn.com/enrolla-gz-new-docs-for-auto-monitor/I-AuNb0y0xUa8HdE/img/traceloop-integrations/posthog-light.png?fit=max&auto=format&n=I-AuNb0y0xUa8HdE&q=85&s=68956c4e4d34f43659f3348b18301624" width="3024" height="1807" data-path="img/traceloop-integrations/posthog-light.png" />

      <img className="hidden dark:block" src="https://mintcdn.com/enrolla-gz-new-docs-for-auto-monitor/I-AuNb0y0xUa8HdE/img/traceloop-integrations/posthog-dark.png?fit=max&auto=format&n=I-AuNb0y0xUa8HdE&q=85&s=4fc1f89b37d0022f8cacca02fafe2060" width="3005" height="1801" data-path="img/traceloop-integrations/posthog-dark.png" />
    </Frame>
  </Step>
</Steps>

**That's it!**

Go to your Posthog instance, click "Activity" and search for events named `traceloop span`.

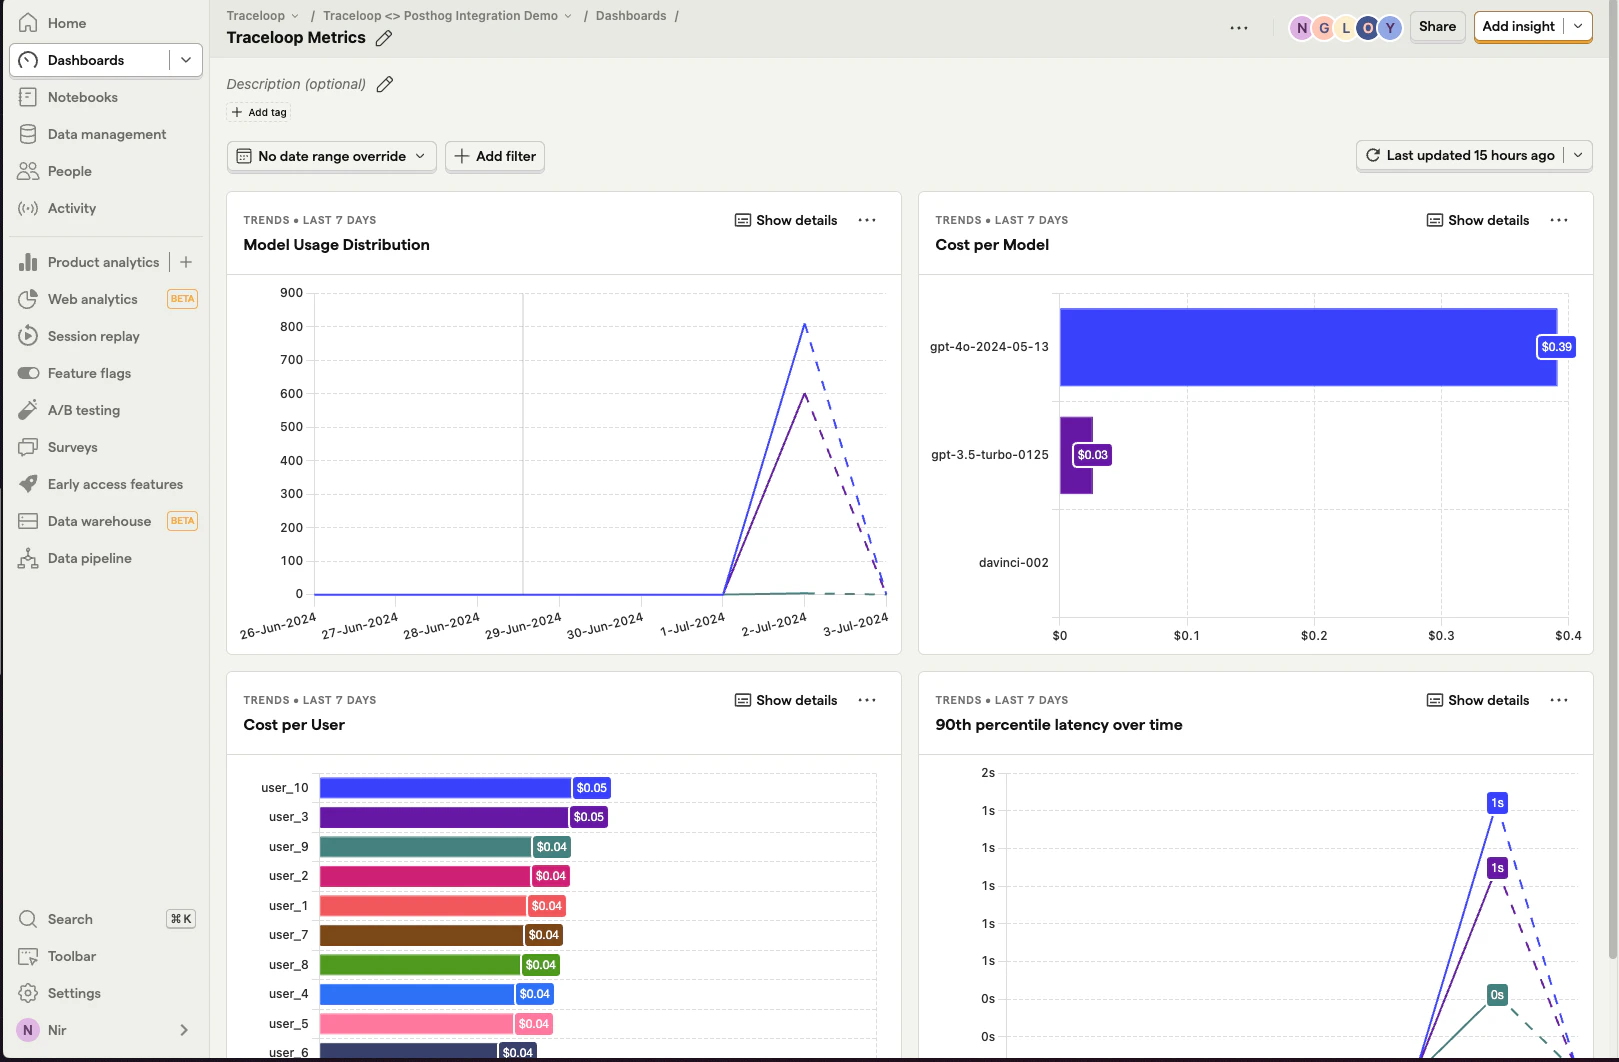
You can then create a new dashboard from the "LLM Metrics - Traceloop" template to visualize the data.
<Frame>
  <img src="https://mintcdn.com/enrolla-gz-new-docs-for-auto-monitor/I-AuNb0y0xUa8HdE/img/traceloop-integrations/posthog-result.png?fit=max&auto=format&n=I-AuNb0y0xUa8HdE&q=85&s=ec430bb7eb6413b283fb32355cfb23a9" width="1619" height="1062" data-path="img/traceloop-integrations/posthog-result.png" />
</Frame>
